At present NFORS has two modules available to customers, the analytics suite and the exposure module. Very different data is collected by these two modules, but there are common lines along which they can be joined. The focus of this article will be on the NFORS analytics module.
The nature of NFORS data
A data feed from local or regional CAD providers
The NFORS analytics module consists of incoming data feeds provided by local or regional CAD providers. These data feeds are parsed in order to map the incoming data to a common underlying schema, outlined in the data dictionary tab. This data is then presented to subscribing departments via a business intelligence-style dashboard and visualization interface.
Data underlying NFORS is processed and stored as singleton documents adhering to a flexible schema. While there are a "core" of base fields that are "guaranteed," there are often additional fields added on a department specific basis according to operational need. Thus, certain data fields are fire department specific, requiring either a particular type of CAD software or special exposure of RMS data in order to be provided. An example of such a field might be a particular unit's distance from the incident at dispatch, which typically requires a department to have automatic vehicle locator (AVL) capability as well as a CAD that provides such information in its incident logs.
Statically collected data at the time of onboarding
A number of fields in NFORS rely on a one-time exchange of data with the fire department. These fields will typically not respond to changes in the CAD interface, and at present must be updated by a subsequent exchange of information with the department. These fields are as follows:
- Shift Schedule — The fire department's shift schedule for appending the shift to incoming incidents. This typically does not change except under extraordinary circumstances.
- Apparatus Unit ID and Unit Type— The unit IDs associated with the department's apparatuses, and what type of apparatus they are, e.g. Engine, BLS, ALS, Rescue, etc. This can change when the department is retiring or acquiring apparatuses.
- Apparatus Station Assignments — The station to which a given apparatus is assigned. This field can actually change operationally, but except in the case of very large departments is generally quite static. Note that some CAD systems can also supply this information more dynamically.
Data prerequisites for ERF calculation
ERF calculations and timing for incidents are available in NFORS, provided the necessary data is provided by the fire department in a one-time exchange, to be updated as necessary. A table containing the following data elements for every call/nature code is required:
- ERF personnel requirements — For the given call, the amount of personnel required on-scene for ERF to be met
- ERF risk category — The risk category (low/medium/high) that the department attributes to a given call type. For example, a non-emergent ems response may be classified as "low", while a high-rise structure fire may be classified as "high".
- ERF response class — the general classification, Fire/EMS/Rescue/HazMat/Other, that a given call/nature code falls into.
- Apparatus staffing — For every apparatus, the assigned number of personnel is required.
The basic units of data
NFORS collects incoming data from CAD vendors for every incident. This means that data is parsed at an individual incident level. However, any given parsed incident will have an apparatus field that contains deeply nested information related to apparatus assignment and response during the incident. These fields are parsed and flattened to form another view of the data using individual apparatus responses, rather than incidents, as the basic unit of data. Thus, NFORS provides two basic units by which one may interact with data:
Incident — This contains the basic facts surrounding the incident, as well as incident-relevant operational metrics such as timing on first unit arrival, incident duration, etc.
Apparatus Response — This duplicates the information held in the incident index, but further exposes individual apparatus information such as the unit id, unit type, and individual response timing such as dispatch, enroute, arrival, and cleared timestamps.
Working with NFORS data
On data ingest, certain checks are performed on NFORS data in order to provide preliminary protection against possible data errors without sacrificing the presence of that data.
Data Quality checks
NFORS performs two kinds of automated data quality checking on ingest, validation of incidents, and potential suppression of apparatus data.
Validation is the process of examining an incoming incident to determine whether any necessary or required fields are missing, or whether any expected fields are malformed, for example a field that is supposed to be a timestamp containing an improper format or garbled characters. These types of errors result in the validation.valid field of the incident being flagged as "false", and the corresponding error being recorded for reference in the validation.errorsText field. Additionally, these incidents are excluded from subsequent inter-incident calculations such as the "concurrent incidents" box shown in incident reports.
Suppression refers to the examination of apparatus responses for inconsistencies in their unit status timing. Occasionally, inconsistencies in unit status timing will arise in apparatus responses. For example, a unit that shows up in the CAD incident data will not have a dispatch timestamp, or will have an arrival timestamp that predates its dispatch. When such anomalies are detected, the apparatus_data.suppressed field is set to "true", and the reason for the suppression, such as "Unit is without dispatch timestamp" is recorded in the apparatus_data.suppressedText field. Further, the unit is excluded from all follow-up calculations involved with the incidents, such as units dispatched/arrived, and any timing calculations related to first unit dispatched/enroute/arrived.
apparatus_data.suppressed = 'false' in order to exclude anomalous response from your analysis!
Outliers
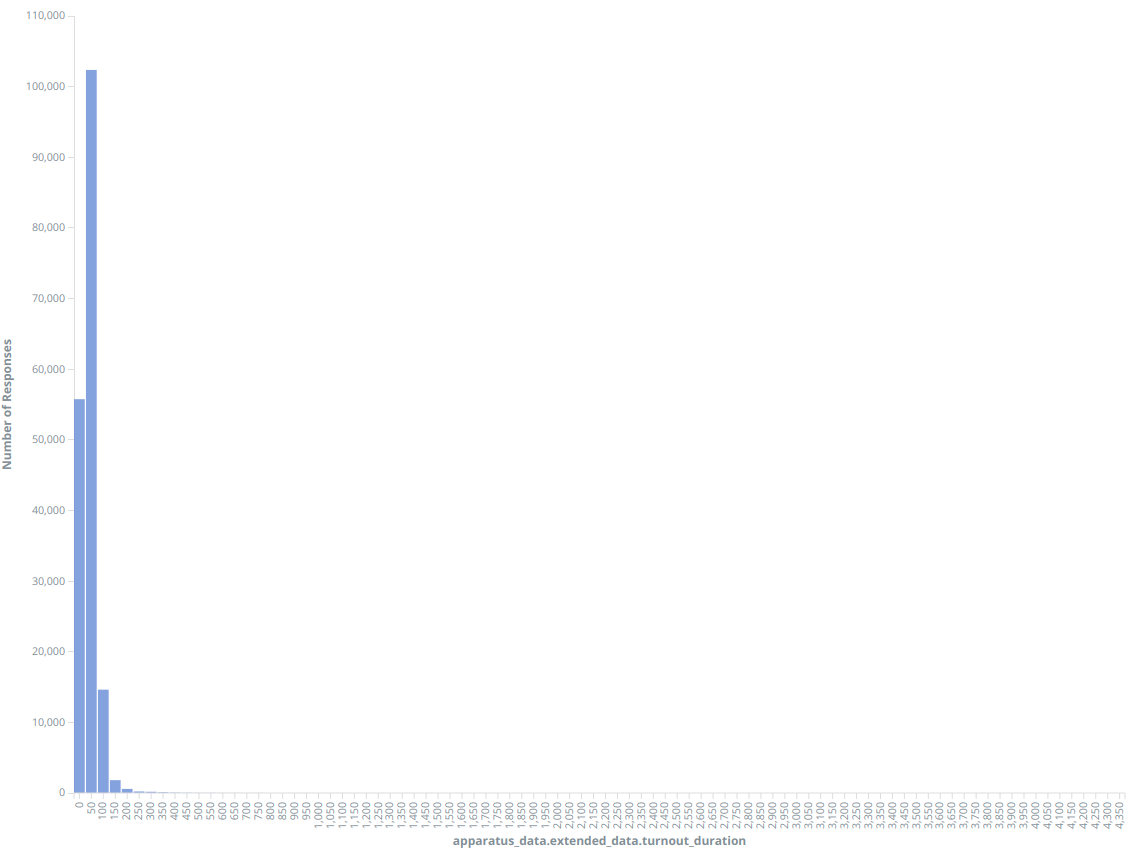
NFORS data is prone to exhibiting conspicuously large values in some fields, referred to as outliers. Typically, outliers occur with unit status update timestamps from incoming CAD incidents. Consider a sample incident taken from one of our fire departments with the following values:
apparatus_data.unit_status.dispatched.timestamp = August 22nd 2019, 18:54:31.000
apparatus_data.unit_status.enroute.timestamp = August 22nd 2019, 20:07:40.000
apparatus_data.extended_data.turnout_duration  = 4,389 (seconds)
Where the turnout_duration is the time in seconds between the dispatched and enroute timestamps. This value implies that for the unit under consideration in responding to an incident took over an hour to get en route to the incident after being dispatched. Is this normal for this department? If we look at the histogramhistogram below, we see that the vast majority of apparatus responses are 200 seconds or under. Indeed, the value we observed appears to be extremely out of place compared with most of our responses.
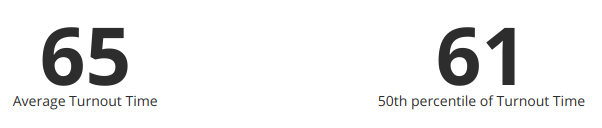
Outliers like these can have sizeable impacts on certain summary metrics like averages. Here are the average and median (50th percentile) turnout times (in seconds) for responding units across the department with the above histogram.
However, if we choose to filter for only responses that are between 0 and 300 seconds, assuming they are caused by errors, our metrics shift in the following manner.
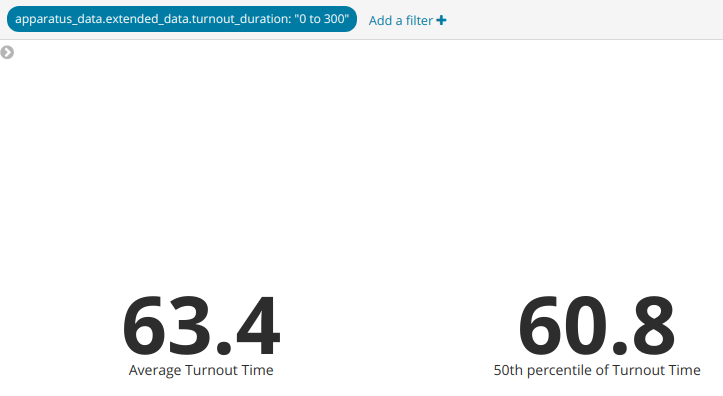
The average is reduced by 1.6 seconds, while the median shifts only 0.2 seconds.
There are 3 approaches commonly used for dealing with outliers.
-
Use "robust" estimators such as percentiles instead. percentiles are generally insensitive to outliers, because they are choosing the value below which some percentage of the data fall, rather than calculating using the values of all the data. As an extreme example, the median of the numbers [1, 2, 3, 4, 1000000] would be 3, whereas the average would be 200002.
-
Remove the offending outliers. Often, this manifests as selecting a reasonable threshold above which the incidents are all likely fluke outliers, and filter out all incidents above that threshold. This would be akin to the filter we applied above.
-
Change the values of the offending outliers to a "large" but not "ludicrous" value. Seen occasionally in analyses, outliers will be "truncated" to a "ceiling" value rather than removed in order to preserve other data in the incident, typically for regression analyses. This approach is not natively supported by NFORS, nor is it recommended when only summary statistics of a single field are desired.